FAQ
- Former user (Deleted)
- David Heiman
- Michael Lawrence (Unlicensed)
- Former user (Deleted)
Frequently Asked Questions
Q: The TCGA is now over and the DCC data portal is offline, where do I find legacy information about TCGA?
A: TCGA data processing formally ended in July of 2016, with content from its data portal and CGHub having been migrated to the NCI Genomic Data Commons data portal. We suggest that all questions about TCGA data, policies, practices and procedures be directed to the TCGA program office, the NCI Center for Cancer Genomics, or the Genomics Data Commons (or GDC).
Q: I understand that TCGA data has migrated to the GDC, but why do I see discrepancies between GDC and FireBrowse?
A: Note that the GDC serves both HG38 and HG19 data. The HG19 data are considered “legacy” and represent the original calls as made by each of the sequencing centers in TCGA; they ARE NOT the default data served by the GDC, and instead are served from the (slightly hidden) legacy archive section of the GDC portal. By default the public GDC interface serves HG38 data; these are newly generated at the GDC itself, with the intent to smooth over differences across the entire set of TCGA samples by “harmonizing” them with common variant callers and reference data. It is important to understand that these HG38 data are not the original HG19 legacy data that is discussed in most of the current TCGA publications. Lastly, note that the public GDAC Firehose & FireBrowse portals ONLY serve HG19 data; we’ve been reluctant to release HG38 data (and analyses of them) to the general public until they have gone through more in-depth QC/vetting. This QC has not been fully completed yet, but is an active area of investigation (with an analysis working group, or AWG) within the nascent GDAN. We are aiming to have a first release of HG38 GDAC pipelines in FireBrowse by Q1 of 2018, after the QC group completes its assesment to the satisfaction of the NCI.
Q: What is the best way for us to contact you?
A: To help us respond to you faster, and more completely, it is best to use one of these methods to contact us as a group, instead of emailing privately to individuals on our team.
Q: Where is your documentation?
A: Though the data and software in our pipeline is constantly evolving, we believe that process clarity & operational transparency streamlines efforts and ultimately improves science. We therefore endeavor to provide a reasonable level of background data processing and algorithm documentation, given our time, resource, and priority constraints. In addition, we generate hundreds of analysis reports per month, each containing detailed summaries, figures, and tables, as well as literature references and links to other documentation on the algorithmic codes in our pipeline. For each run we also provide a summary report of samples ingested, and analysis notes and data notes. Our pipeline nomenclature is described below, and further description of the TCGA data formats is available here. Finally, the analysis tasks in the latest run are shown below as a directed graph, which you may click to expand, and then click upon any enabled nodes to view the Nozzle report generated for that analysis result.

Q: Your documentation does not describe what the clinical term X.Y.Z means, where can I find this?
A: The Broad GDAC did not generate the source clinical data, so we can only tell you how we've collected, processed and analyzed it. But, in our clinical pipeline documentation there is a series of links to additional information from the NCI, including: how clinical data are harmonized at the GDC; the TCGA code tables; the BCR and Clinical data specifications, and an example questionnaire given to a tissue source site(s) from which samples were collected. If this does not help then we recommend contacting the Genomic Data Commons (as noted above), since they are the current stewards of the legacy TCGA data.
Q: How or where can I access the inputs and/or results of a run?
A: In one of several ways, all of which are governed by TCGA data usage policy (and note that only the TCGA DCC requires password access, all Firehose and FireBrowse mechanisms are completely open for public use):
- Interactively within the FireBrowse UI
- Programmatically from FireBrowse through one of several means:
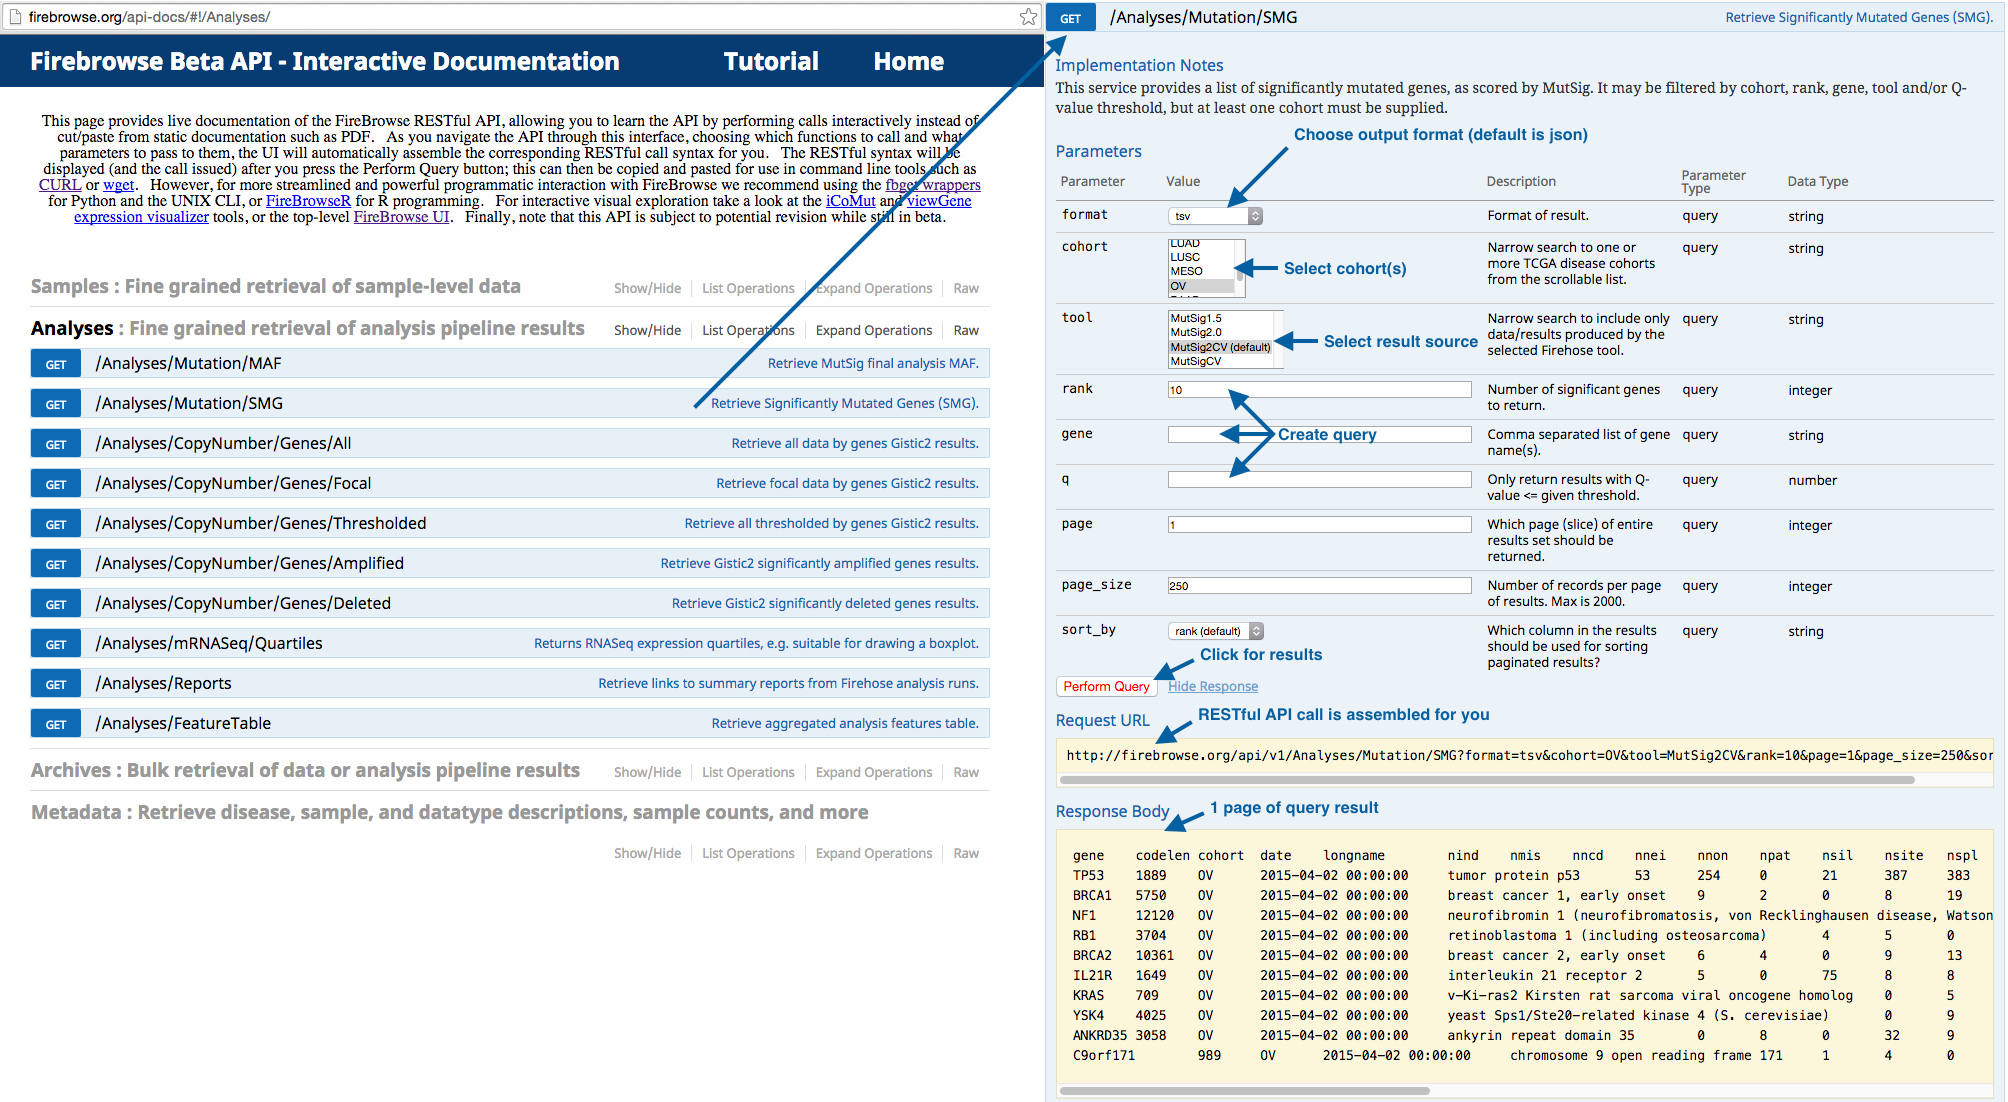
- The interactive RESTful API documentation
- The fbget Python/UNIX CLI bindings (also obtainable with "pip install firebrowse")
- The FireBrowseR bindings for R
- En masse, using the firehose_get utility. It is worth noting that the FireBrowse RESTful API and firehose_get have different strengths: for fine-grained query and retrieval (e.g. the expression of a single gene, across all samples in a single cohort) the FireBrowse API is the better choice; but for bulk downloads (e.g. the expression of all genes, across all samples and cohorts) then firehose_get will yield significantly better performance.
- The meta-dashboard on our gdac.broadinstitute.org home page
- Directly from our standardized data dashboard or analysis dashboard
- Directly from the IGV File->Load From Server menu
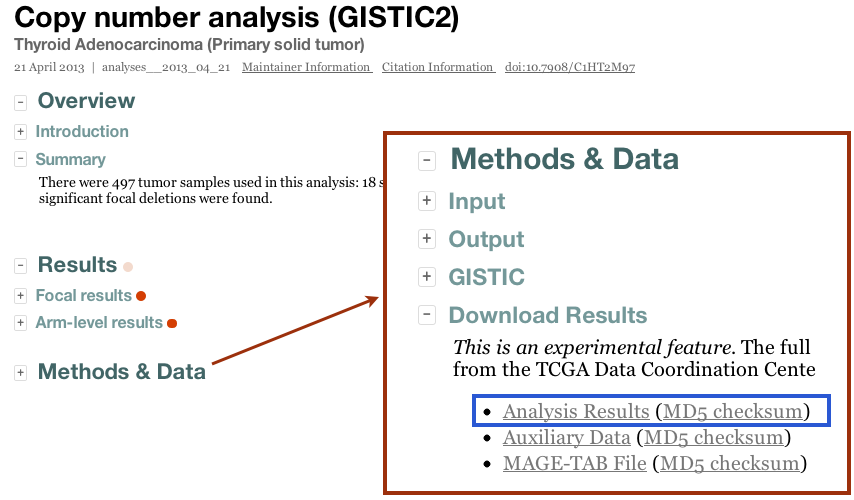
- By clicking the "Download Results" tab in the Methods & Data section of our online reports:
- From the TCGA DCC. This requires TCGA protected data credentials, but after logging in you should see something like

from which you may simply navigate to the tumor type and run date of interest. More information on the nomenclature and content of these files is given below. Microsoft Windows-based users can use the WinRAR utility to unpack the archive files, while Unix and Apple Mac OS/X users can use the gzip and/or tar utilities.
Q: That's great, but how do I navigate all of your results on the web?
A: There are multiple ways to navigate our online results. The best place to start is firebrowse.org:
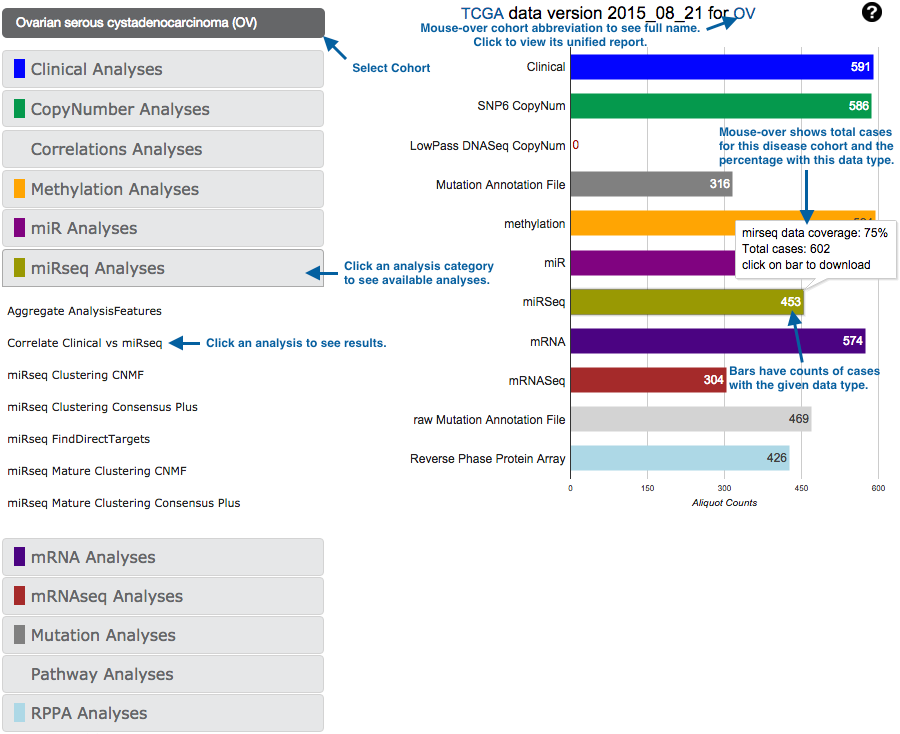
This gives you access to both our standard data packages (right column), and the results of our standard analyses suite (left column).
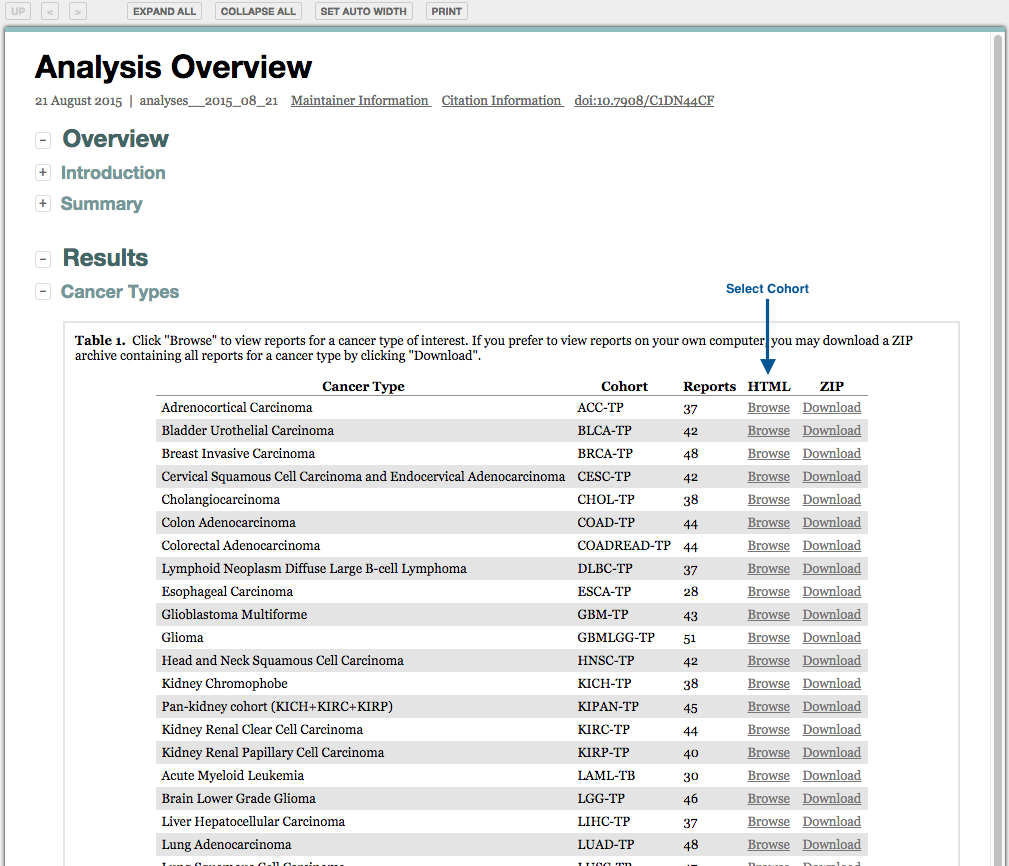
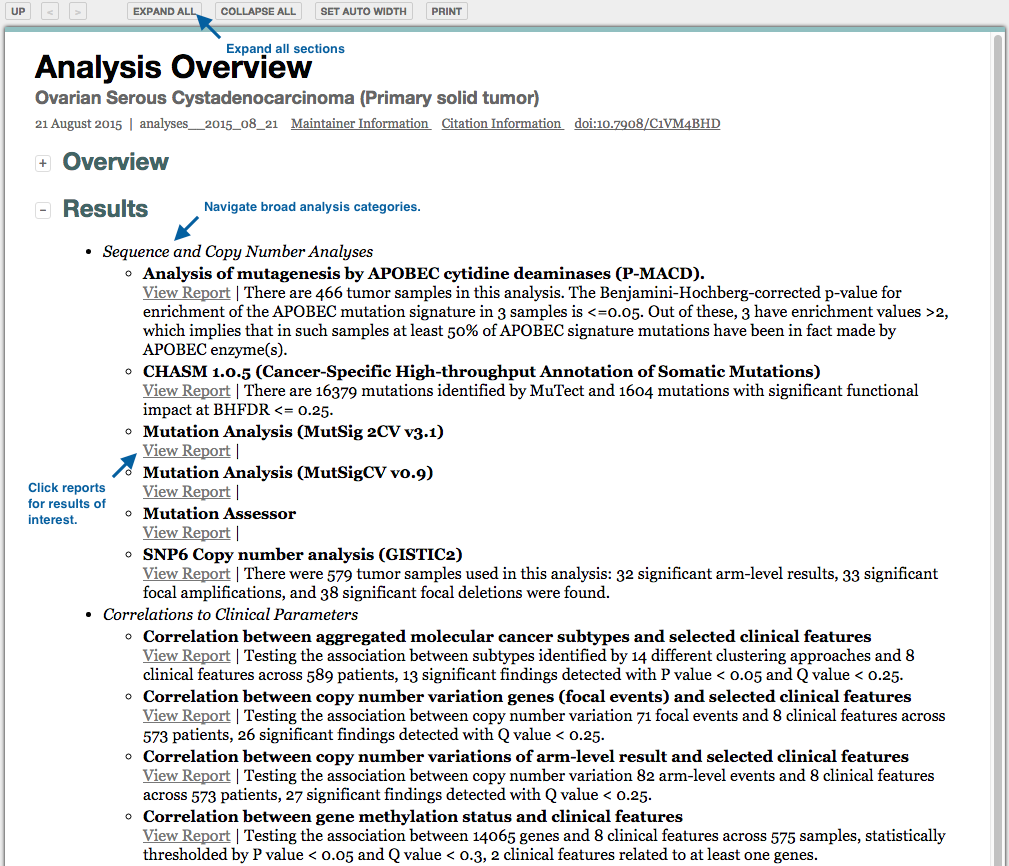
Analyses results may also be accessed from the unified reports:
For fine-grained querying of results via the web, we have an interactive API:
This querying can also be done programmatically via Python bindings, UNIX CLI, or R bindings.
Q: Can I easily search your entire suite of runs and results?
A: Yes, in multiple ways: First, our homepage includes a Google-powered search mechanism

The same Google search mechanism is available in FireBrowse, in addition to the wealth of query capability already offered by the FireBrowse API. Please see these search examples for ideas; we intend to continually improve our search capability, by adding new keywords, synonyms, annotations etc.
Q: How do I cite Firehose results in my paper?
A: In one of several ways:
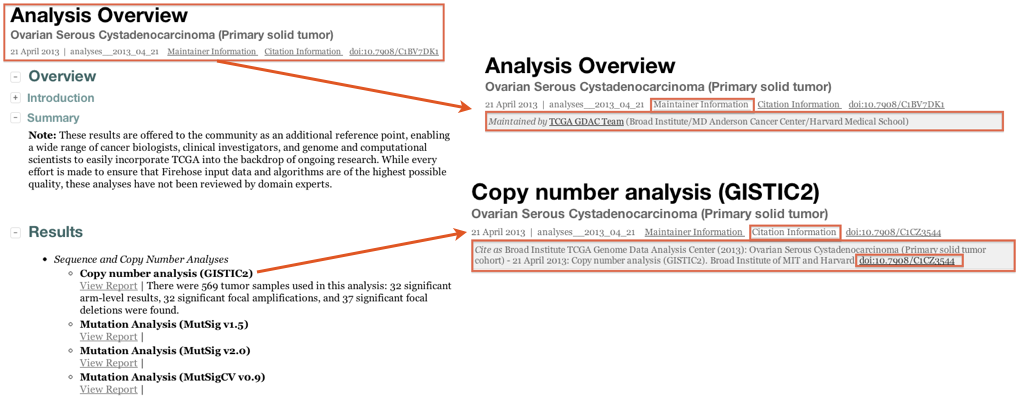
Standard Analysis Runs: as of the April 2013 analysis run, each GDAC Firehose analysis report contains a Digital object identifier (DOI), thus enabling it to be citable directly in the literature:
Standard Data Runs: If you have used any of our data archives in your research then please cite the respective data run using the instructions and DOIs given here.
Manuscript: the GDAC Firehose manuscript is under preparation, and when published will provide an additional reference point for citation.
Q: When is the next run?
A: As of December 2014 the Broad Institute GDAC will aim to provide:
- 1 standard data run every 2 months; these will be from a DCC data snapshot taken at that time
- 1 standard analysis run every other data run, yielding 3 analysis runs per a year
- Custom AWG runs will still be performed on an as-needed basis
Q: How do I use a graphic from FireBrowse in my paper?
A: The FireBrowse visualization widgets (viewGene, iCoMut) do not explicitly provide a screen-capture feature; but if you use your browser's Print feature and then save the result to a PDF, you'll have a vector-graphics image than can be scaled without loss of fidelity.
Q: There are many acronyms used in TCGA, for example to identify disease cohorts. Where can I find what these acronyms mean?
A: Consult the TCGA Encyclopedia for general questions. There are several ways one can map cohort abbreviations to full disease names, including:
- Top level GDAC portal: http://gdac.broadinstitute.org
- FireBrowse metadata API: http://firebrowse.org/api/v1/Metadata/Cohorts?format=json
- Perusing the GDAC samples report: http://gdac.broadinstitute.org/runs/stddata__latest/samples_report
- Legacy TCGA data portal page
Note that our portals list 38 cohorts and the TCGA page shows 34 cohorts, with the difference being aggregate cohorts the Firehose GDAC constructed for convenience of TCGA and the research community. As of December 2016 these aggregate cohorts are:
COADREAD: colorectal, combines COAD + READ
GBMLGG: glioma, combines GBM + LGG
KIPAN: pan-kidney, combines KICH + KIRC + KIRP
STES: stomach-esophogeal, combines STAD + ESCA
PANGI : not publicly available yet, but combines STES + COADREAD
Q: Why does your table of ingested data show that disease type XYZ has N mutation samples?
A: Our precedence rules for ingesting mutation samples are:
- Prefer manually-curated MAF from the respective analysis working group (AWG), on the premise that it represents the best available understanding of mutations for that disease.
- When no AWG MAF is available, fall back to using what is available in the DCC by automatic submission from the respective sequencing center(s) for that disease.
- Otherwise Firehose will contain zero mutation samples for that disease type.
- When additional mutation samples accrue at the DCC (submitted by the respective GSCs) after the initial marker paper is published for a given disease, we create a rawMAF for use in our analyses runs, enabling analysts to foster the most comprehensive assessment of that disease.
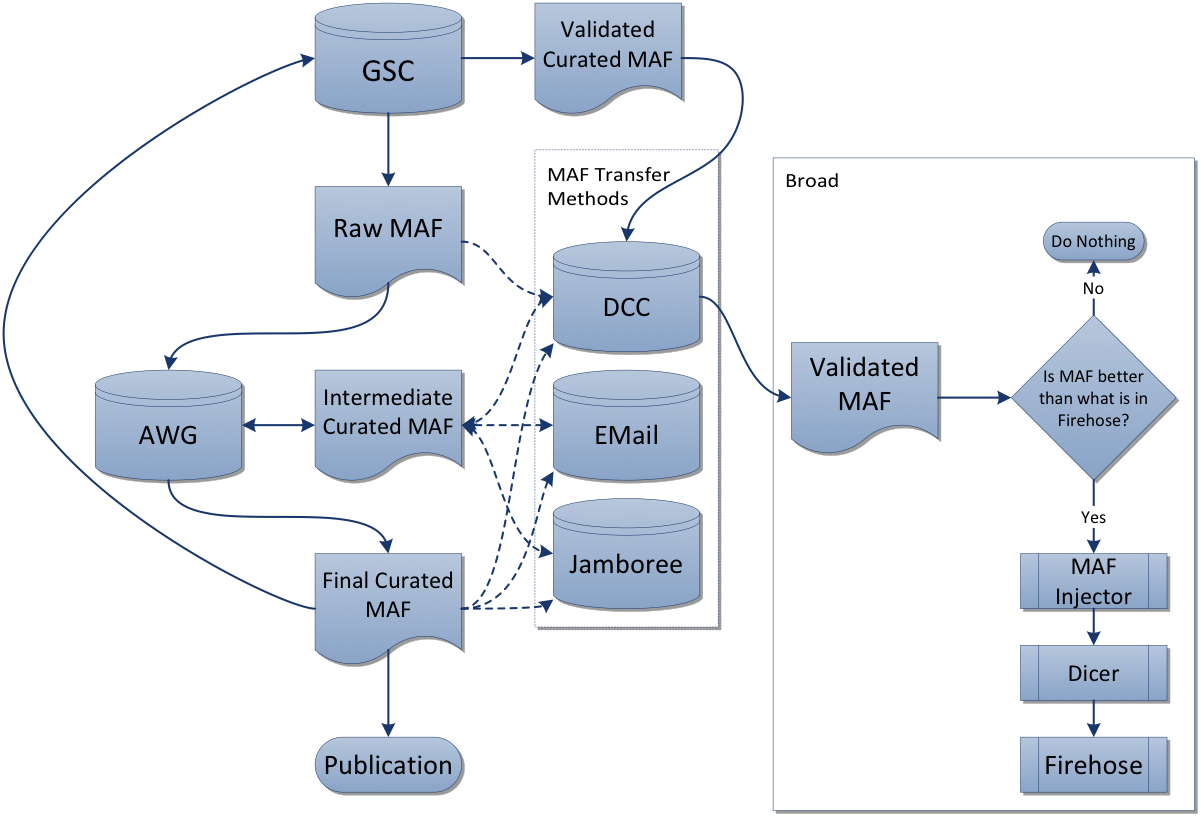
For more information, please consult our provenance table for mutation data, the TCGA MAF workflow, the DCC MAF files inventory, and our MAF Dashboard.
Q: How can I determine the allelic fraction of mutations in your MAF files?
A: Unfortunately, there is no guarantee that a MAF file will have this information, as it is not indicated in the MAF Specification. Some centers have added this information as custom columns; for instance many Broad MAFs may have t_ref_count and t_alt_count from MuTect, and WashU MAFs may have tumor_vaf.
Q: Where can I find the mutation rates calculated during Firehose analyses?
A: Mutation rates are calculated by MutSig, and can be found in the patient_counts_and_rates.txt file bundled within the MutSig result archives. You can retrieve these archives with firehose_get or through the firebrowse.org user interface (e.g. here is a link for MutSig2CV analysis results for adrenocortical carcinoma, or ACC). In addition, we plan to add mutation rates to the FireBrowse api in the near future.
Q: What are the differences between MutSig 1.5, 2.0, CV, and 2CV?
A: MutSig relies on several sources of evidence in the data to estimate the amount of positive selection a gene underwent during tumorigenesis. The three main sources are:
- Abundance of mutations relative to the background mutation rate (BMR)
- Clustering of mutations in hotspots within the gene
- Conservation of the mutated positions (i.e. did the mutation happen at a position that is conserved across vertebrates?)
The first line of evidence, Abundance, goes into the core significance calculation performed in all versions of MutSig. In MutSig1.0, this is simply called "p". MutSig1.0 assumes a constant BMR across all genes in the genome and all patients in the patient cohort. In MutSig1.5, this is also called "p", but MutSig1.5 uses information from synonymous mutations to roughly estimate gene-specific BMRs. Later versions of MutSig (MutSigS2N and MutSigCV) have increasingly sophisticated procedures for treating the heterogeneity in per-gene, per-patient, and per-context BMRs, but they are all answering essentially the same question about Abundance of mutations above the background level.
The other lines of evidence, Conservation and Clustering, are examined by a separate part of MutSig that performs many permutations, comparing the distributions of mutations observed to the null distribution from these permutations. The output of this permutation procedure is a set of additional p-values: p_clust is the significance of the amount of clustering in hotspots within the gene. p_cons is the significance of the enrichment of mutations in evolutionarily conserved positions of the gene. Finally, p_joint is the joint significance of these two signals (Conservation and Clustering), calculated according to their joint distribution. The reason for calculating p_joint is to ensure there is no double-counting of the significance due, for example, to clustering in a conserved hotspot.
MutSig2CV combines all three lines of evidence. More information on MutSig is available on its entry in the CGA software page, the 2013 and 2014 MutSig publications, dozens of TCGA-related papers, and in their respective reports.
Q: What do the different fields for significantly mutated genes mean?
A: Many of these fields depend on what version of MutSig was used. The following table covers the majority of them:
| Fields | Description | |||
| MutSig_1.5 | MutSig_2.0 | MutSig_CV | MutSig_2CV | |
| gene | gene | gene | gene | HUGO Symbol |
| description | description | longname | Full description/name of the gene | |
| N | N | number of sequenced bases in this gene across the individual set | ||
| n | n | number of (nonsilent) mutations in this gene across the individual set | ||
| nnon | nnon | number of nonsense mutations | ||
| npat | npat | npat | npat | number of patients (individuals) with at least one nonsilent mutation |
| nsite | nsite | nsite | nsite | number of unique sites having a nonsilent mutation |
| nsil | nsil | nsil | nsil | number of silent mutations in this gene across the individual set |
| n1 | n1 | number of nonsilent mutations of type "*CpG->T" | ||
| n2 | n2 | number of nonsilent mutations of type "*Cp(A/C/T)->T*" | ||
| n3 | n3 | number of nonsilent mutations of type "A->G" | ||
| n4 | n4 | number of nonsilent mutations of type "transver" | ||
| n5 | n5 | number of nonsilent mutations of type "indel+null" | ||
| n6 | n6 | number of nonsilent mutations of type "double_null" | ||
| p_ns_s | p_ns_s | p-value for the observed nonsilent/silent ratio being elevated in this gene | ||
| p | p | p | p | p-value (overall) |
| q | q | q | q | q-value, False Discovery Rate (Benjamini-Hochberg procedure) |
| p_classic | p-value for the observed amount of nonsilent mutations being elevated in this gene | |||
| p_clust | pCL | Clustering. Probability that recurrently mutated loci in this gene have more mutations than expected by chance. While pCV assesses the gene's overall mutation burden, pCL assesses the burden of specific sites within the gene. This allows MutSig to differentiate between genes with uniformly distributed mutations and genes with localized hotspots. | ||
| p_cons | pFN | Conservation. Probability that mutations within this gene occur disproportionately at evolutionarily conserved sites. Sites highly conserved across vertebrates are assumed to have greater functional impact than weakly conserved sites. | ||
| p_joint | p-value for joint model of clustering and conservation | |||
| pCV | Abundance. Probability that the gene's overall nonsilent mutation rate exceeds its inferred background mutation rate (BMR), which is computed based on the gene's own silent mutation rate plus silent mutation rates of genes with similar covariates. BMR calculations are normalized with respect to patient-specific and sequence context-specific mutation rates. | |||
| codelen | the gene's coding length | |||
| nncd | number of noncoding mutations | |||
| nmis | number of missense mutations | |||
| nstp | number of readthrough mutations | |||
| nspl | number of splice site mutations | |||
| nind | number of indels | |||
Q: Where did my mutations go?
A: MAFs processed by MutSig may have mutations removed for one of several reasons:
- They are on contigs other than chr1-22/X/Y
- They are malformed in some way, e.g. purport to be a “mutation from C to C”, or are an unknown Variant_Classification (e.g. Targeted_Region)
- They are noncoding mutations or in genes absent from MutSig's list of gene definitions, or in poorly covered genes (by historic coverage metrics)
- They are in the “mutation blacklist,” a static list of positions observed in the past to harbor common artifacts or germline variation.
- They occur in patients MutSig deems to be duplicates.
Q: Where can I find a copy of the blacklist used in MutSig runs?
A: The blacklist is used to filter out recurrent mutation sites that the MutSig development team found to cause issues with the determination of significance. Because these by nature include germline mutations that may not have been part of available databases at the original generation of the MAF, we are not permitted to release it to the public.
Q: Why does your table of ingested data show that disease type XYZ has N methylation samples?
A: We ingest and support both of the major methylation platforms (Infinium HumanMethylation450 and HumanMethylation27), therefore the entries in our data table give the sum of both. However, as noted in our June 2012 release notes, Firehose does not yet include the statistical algorithms used by TCGA AWGs to merge both of these methylation platforms into a single bolus; until those are shared we prefer meth450 over meth27 when available for a given disease type, as it gives not only greater sample counts but also higher resolution data.
Q: What TCGA sample types are Firehose pipelines executed upon?
A: Since inception Firehose analyses have been executed upon tumor samples and then correlated with clinical data. Nearly all analyses utilize primary solid tumor samples (numeric code 01, short letter code "TP" as given in the TCGA sample type codes table), with two exceptions:
- melanoma (SKCM), where we analyze metastatic tumor samples (numeric code 06, short letter code "TM")
- acute myeloid leukemia (LAML), which we analyze using primary blood-derived samples (numeric code 03, short letter code "TB")
Programmatically, the FireBrowse patients api will give you a list of all patients in each cohort, either in bulk (all cohorts) or any subset you chose. It doesn’t give the complete aliquot barcode yet, but will in the very near future. In addition to playing with this API interactively through the FireBrowse UI, there are also Python, Unix, and R bindings, and even a pip-installable package.
Q: How do I analyze samples that aren't included in your Firehose runs (e.g. Blood Normals, Solid Tissue Normals, etc.)?
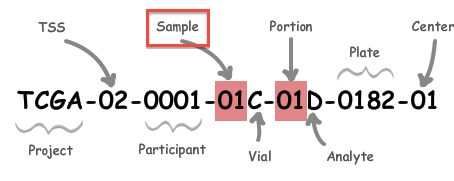
A: All analysis-ready patient samples are available in our stddata archives; this will include matched normals, where available (but note that the so-called TCGA control samples are not included). Normals can be identified by inspection of the barcode schema below, in conjunction with the TCGA code tables. You can obtain the stddata archives using our firehose_get utility or by traversing the FireBrowse user interface or stddata API. Each sample in the archive is identified by a TCGA Barcode that contains the sample type. As shown below, the Sample portion of the barcode can be looked up in the sample type code table available here (as can the tissue source site, aka TSS, et cetera). In addition, FireBrowse makes much of this information available programmatically in its metadata API.
TCGA Barcode Description: As described here, a batch is uniquely determined by the first shipment of a group of analytes (or plate) from the Biospecimen Core Resource. So, in most cases the plate number of a sample is effectively synonymous with the batch id of the sample; an exception to this is when additional analytes from a participant are subsequently shipped the batch id will remain fixed at the first plate number.
Q: Where can I find additional information about a TCGA sample/analyte
A: While the TCGA was active samples notes (aka annotations) had been maintained at the TCGA Annotations Manager. In July of 2016, however, the data portal of TCGA went offline, with all data (including annotations) having been migrated to the Genomic Data Commons. Please contact the GDC staff for details on how annotation information may be obtained after July 2016.
Q: What do you do when multiple aliquot barcodes exist for a given sample/portion/analyte combination?
A: To date GDAC analyses have proceeded upon one single tumor sample per patient, so when multiple aliquot barcodes exist we try to select the scientifically most advantageous one among them. Given the absence of disambiguating QC metrics, we use the following rules to make such selections:
- Prefer H analytes over R, and R analytes over T, when RNA aliquots of mixed types exist (i.e. H > R > T).
- Prefer D analytes (native DNA) over G, W, or X (whole-genome amplified),
- unless the G, W, or X analyte barcode has a higher plate number
- Otherwise prefer the aliquot with the highest lexicographical sort value, to ensure that higher portion and/or plate numbers are selected when all other barcode fields are identical.
For example, consider the archive
broad.mit.edu_LUSC.Genome_Wide_SNP_6.mage-tab.1.2001.0
which contains, among many others, the following aliquot barcodes
TCGA-37-4130-01A-01D-1097-01
TCGA-37-4130-01A-01D-1969-01
By the above rules our pipelines would select the second aliquot, as it has the higher plate number. Finally, note that as of Fall 2013 we segregate FFPE samples from frozen tissue samples (and have never performed analyses upon FFPE samples); this segregation is reflected in the sample counts and provenance of our samples summary report, with FFPE cases being listed in their own section.
Q: The DCC site shown above is protected, how do I obtain the TCGA access credentials?
A: Begin by visiting the TCGA data access page.
Q: What reference genome build are you using?
A: We match the reference genome used in our analyses to the reference used to generate the data as appropriate. Our understanding is that TCGA standards stipulate that OV, COAD/READ, and LAML data are hg18, and all else is hg19. caveat: SNP6 copy number data is available in both hg18 and hg19 for all tumor cohorts, so we use hg19 for copy number analyses in all cases.
Q: How are the copy number data generated, and what do their file names mean?
A: This is discussed in the application note posted here: http://www.broadinstitute.org/cancer/cga/copynumber_pipeline. Note that the 'minus_germline, or 'nocnv' segment files, refer to whether the steps in section 2.3 are applied. The steps in section 2.4 are applied regardless.
Q: What centers are responsible for sequencing XYZ tumor?
A: Internally at the Broad we maintain /wiki/spaces/CGW/overview#CancerGenomeWorkgroup-Tumor_Sequencing_Centers If you are outside the Broad please consult the TCGA site for more information.
Q: How do I add my code to your Firehose pipeline?
A: Here is a document which outlines the general requirements for adding codes to Firehose.
Q: But where do I get Firehose data to test my module?
A: This is described above.
Q: Your results archives have long and complicated names, what do they mean?
A: Our result archive and sample set nomenclature is described here. An older version, pertaining to results submitted before January 2013, is given here.
Each pipeline we execute results in a set of 6 archive files being submitted to the DCC: primary results in the Level_* archive; auxiliary data (e.g. debugging information) in the aux archive, tracking information in the mage-tab archive; and an MD5 checksum file for each. In most cases you will only need the primary results in the Level_* archives.
Q: What is the difference between RPKM and RSEM mRNASeq data?
A: RPKM and RSEM are different methods for estimating expression levels from mRNASeq data. RPKM (Reads Per Kilobase per Million mapped reads) is described in a paper by Mortazavi, Williams, McCue, Schaeffer & Wold titled Mapping and quantifying mammalian transcriptomes by RNA-Seq. RSEM (RNA-Seq by Expectation-Maximization) is considered by many to be a better estimation method and, if available, RSEM data is preferentially used in our downstream analyses. It is described in a paper by Bo Li & Colin Dewey titled RSEM: accurate transcript quantification from RNA-Seq data with or without a reference genome.
Q: How do I map mRNA isoform IDs to genes?
A: We do not provide a mapping table for this, because in TCGA these data are generated by the University of North Carolina. However, for internal analyses we and others frequently use the UCSC Table Browser, e.g. as described in this BioStars recipe.
Q: What can you tell me about the RPPA data?
A: RPPA stands for "reverse phase protein array," which are data generated by the M.D. Anderson Cancer Center as described here. The MDACC also hosts the TCPA portal, which serves clean, batch-corrected RPPA data that may be preferred for your analysis over the uncorrected data deposited directly to the TCGA data coordination center.
Q: I have a question about sequencing data generated by the Broad Institute, are you the right group to ask?
A: No. Sequencing at the Broad Institute is performed by the Genomics Platform, and they can be reached at genomics@broadinstitute.org.