Versions Compared

Key

  • This line was added.
  • This line was removed.
  • Formatting was changed.

  Release notes for the standardized data upon which these analysis runs are based are available here

Anchor
2016_01_28__patch
2016_01_28__patch


Panel
titleBGColorlightblue
titlePatch: October 2016

NOTE: The LIHC RPPA data submitted by MDACC early in 2016 were discovered to be mislabelled MESO samples. Thus the 2016_01_28 analyses and standard data pipelines for LIHC have been re-run using the corrected samples submitted in March, and the nozzle reports now contain notices of the discrepancies.

The following table shows the changes in sample counts for RPPA data as a result of this patch:

HNSC

+145

(357 total)

LIHC

+121

(184 total)

THCA

+146

(368 total)


Anchor
Spring_2016
Spring_2016

Panel
bgColorwhite
titleBGColorlightblue
titleSpring 2016 Analysis Run
  1. This is likely to be either the penultimate or perhaps even final standard Firehose analysis run of the TCGA project. Custom AWG runs will continue for TCGA as needed.

  2. This analysis run was based upon the 2016_01_28 data run and includes 1528 analysis reports.

  3. Summary of sample changes (see the comprehensive samples report for more details) since the Fall 2015 analysis run:

    BCR

    +1

    (11368 total)

    Clinical

    +32

    (11196 total)

    CN

    +2

    (10987 total)

    MAF

    +313

    (7099 total)

    Methylation

    +1

    (10972 total)

    miRSeq

    +2

    (10156 total)

    mRNASeq

    +164

    (10267 total)

    rawMAF

    +2072

    (6322 total)

    RPPA

    +627

    (7429 total)

  4. APOBEC pipelines updated: 
    1. used median filtering in primary APOBEC analysis
    2. in downstream clinical correlations, corrected names of categorical variables and descriptions of how they were utilized
  5. cNMF clustering improvement: new criteria used to select best cluster, identical to that describe in Summer 2014 run (see below) for consensus hierarchical clustering:
    The cophenetic correlation coefficients and average silhouette values are used to determine the k with the most robust clusterings. From the plot of cophenetic correlation versus k, we select modes and the point preceding the greatest decrease in cophenetic correlation coefficient, and from these choose the k with the highest average silhouette value.
  6. Survival analysis: for all clinical correlations
    1. Modified the p-value calculation of survival analysis with continuous data. It now uses the quantile interval categorical values instead of continuous values.
    2. Previously it had one hazard ratio value for one continuous value, but now has multiple hazard ratio values for quantile interval curves (and are now reflected in the plot legends)

  7. FireBrowse:
    1. Updated to v1.1.28 to reflect these run results
    2. iCoMut:
      1. loaded 4 additional disease cohorts: DLBC, ESCA, SARC, and THYM
      2. Completed most of work for major new release, stay tuned for announcement next week, incorporating many graphical and data exploration enhancements

...

Panel
bgColorwhite
titleBGColorlightblue
titleSpring 2015 Run
  1. Over 8000 new aliquots since the Fall 2014 analyses run: see the comprehensive samples report for more details

    BCR

    +38

    (11352 total)

    Clinical

    +1352

    (10945 total)

    CN

    +1

    (10987 total)

    MAF

    +523

    (6584 total)

    Methylation

    +533

    (10955 total)

    miRSeq

    +109

    (10160 total)

    mRNASeq

    +365

    (10095 total)

    rawMAF

    +4250

    (4250 total)

    RPPA

    +1120

    (5456 total)

  2. New rawMAF data type: for some disease studies, mutation samples continued to be collected and sequenced after the respective marker paper data freeze. Until now Firehose has packaged and run analyses only on the mutations in the data freeze for the submitted paper. However, since it's in the best interests of the community to have as many samples as possible for analysis, as of this run we are excited to announce that Firehose now includes MAFs that have accumulated post-publication; we introduce the term rawMAF to describe such samples, connoting that they have not necessarily been curated by a TCGA analysis working group. This effort has added over 1500 new samples to our data stream.

  3. Total of 1480 analysis result reports, an increase of 311 since the last analysis run.
  4. New analysis pipelines:
    1. Pathway_GSEA_mRNAseq
      Performs gene set enrichment analysis for mRNAseq clusters using Broad Institute GSEA MsigDB Class2 canonical pathways. Also inspects core enriched genes for each top significant gene set, and checks their expression fold-change level and significance by eBayes lm fit.

    2. Correlate_Clinical_vs_Mutation_APOBEC_Categorical
      Checks correlation between clinical features and APOBEC groups classified into 3 sample groups of APOBEC high, low and none based on APOBEC MUTLOAD MINESTIMATE and APOBEC Enrichment score.

    3. Correlate_Clinical_vs_Mutation_APOBEC_Continuous
      Checks correlation between APOBEC scores and selected clinical features.

    4. Correlate_mRNAseq_vs_Mutation_APOBEC
      Attempts to calculate the pearson correlation between APOBEC_MutLoad_MinEstimate and mRnaseq data of each gene across samples.

    5. miRseq_FindDirectTargets
      Infers putative direct gene targets of miRs based on miRseq and mRNAseq expression profiles across multiple samples.

    6. Mutation_CoOccurrence
      Tailors the Firehose AnalysisFeatureTable specifically for the iCoMut visualization tool.

    7. Pathway_Overlaps_MSigDB_MutSig2CV
      Checks pathway overlaps for significant genes identified by MutSig2CV using hypergeometric test.  

  5. FireBrowse:
    1. iCoMut: a powerful new synoptic tool for interpretation and exploration  CoMut figures have quickly become a staple of TCGA research. Within a single graphic they provide a comprehensive analysis profile, enabling the reader to quickly infer relationships between co-occurring results. With iCoMut researchers can now explore coMut figures interactively, sorting and reordering samples and results as they see fit.
    2. New viewGene expression visualizer: built on top of the FireBrowse RESTful API, viewGene generates a boxplot of mRNASeq expression levels for a selected gene across all cohorts.
    3. Reports and FeatureTable apis now make older results available, too, not merely those from the latest analysis run. The search criterion is YYYY_MM_DD datestamp.
    4. Many recent enhancements as described in April 2015 stddata run notes.
  6. Issues
    1. The new raw MAF COAD samples contain many InDels, which increased the number of SMGs identified for COAD[READ]: for signficance analysis we internally perform liftover of the COAD[READ] MAFs from hg18 to hg19. Typically this liftover has no appreciable impact on the SMGs identified in MAFs which largely contain simpler mutations, but for the InDel-heavy COAD[READ] MAFs the SMG lists have grown to upwards of 1000 genes. To alleviate this in future runs we will liftover and reannotate with the latest hg19 version of Gencode, using Oncotator in our standard data runs.

...

Panel
bgColorwhite
titleBGColorlightblue
titleSummer 2014 Run
  • We are excited to announce that Firebrowse Beta 1 is available for public use. As described in the short tutorial, with this initial release our aim is to make it significantly easier to explore the large volume of datasets and analysis results produced by our TCGA GDAC Firehose, both interactively as well as programmatically through a set of over 20 nascent RESTful apis which support both coarse- and fine-grained queries.  In the coming months we’ll nudge the API towards maturity while incorporating new analysis and visualization tools, so please visit often and don’t be shy about sharing your feedback!

  • Summary of sample changes since the Spring analyses run (see the comprehensive samples report for more details):

    BCR

    +1143

    (11314 total)

    Clinical

    +604

    (8694 total)

    CN

    +308

    (9474 total)

    MAF

    +380

    (5918 total)

    Methylation

    +681

    (9909 total)

    miRSeq

    +674

    (8875 total)

    mRNASeq

    +524

    (8548 total)

    RPPA

    +1

    (4033 total)

  • Mutation Analyses:
    • MutSig 2CV incorporated into Analyses workflow
    • While older MutSig versions remain in Analysis workflow, MutSig2CV should be considered the preferred version
    • As such, our Analyses workflow no longer merges the results of multiple MutSig versions into a single result for downstream integrative analyses (e.g. correlations)
    • Instead, downstream integrative analyses utilize the MutSig2CV results (with one exception: correlation of mutation rate vs. clinical still uses Mutsig 2.0)
  • Consensus hierarchical clustering improvements:
    • Discontinued use of the much older Java implementation by Monti, et al, in favor of ConsensusClusterPlus R (v1.18.0) package by Wilkerson, et al
    • New criteria used to select best cluster:
      The cophenetic correlation coefficients and average silhouette values are used to determine the k with the most robust clusterings. From the plot of cophenetic correlation versus k, we select modes and the point preceding the greatest decrease in cophenetic correlation coefficient, and from these choose the k with the highest average silhouette value.
  • GenePattern: we have migrated completely away from using GenePattern as a backend for running any tasks in GDAC Firehose
  • Substantial improvements to clinical correlation pipelines:
    • Race and ethnicity are now included in the list of selected tier1 clinical parameters for correlation analyses
    • Nozzle reports now make clear that correlations against miR, miR-Seq, mRNA and mRNA-Seq data use log2 expression levels
    • Discontinued use of parametric statistical tests in favor of non-parametric statistical tests:
      T-test changed to Wilcoxon test, ANOVA changed to Kruskal-Wallis and Chi-square test to Fisher's exact test
    • Significant genes located in sex chromosomes are now filtered, to avoid reporting meaningless correlations
    • The box-plot is now given for EVERY one of N top significant genes, instead of only 1 plot for most significant gene 
  • New Clinical Correlation Analysis: Correlate Clinical vs. Mutation Rate
  • Known Issues:
    • HotNet was not included, due to a MatLab resource conflict
    • CHASM was not included, because it did/would not complete in time
    • BRCA: older MutSig versions (1.5 & 2.0) were not run for BRCA cohort: its large size was causing insufficient memory errors
    • OV: methylation clustering failed, too few Meth450 samples available but enough that Firehose preferred them over the 592 old Meth27 samples

...

Panel
title2013_03_26

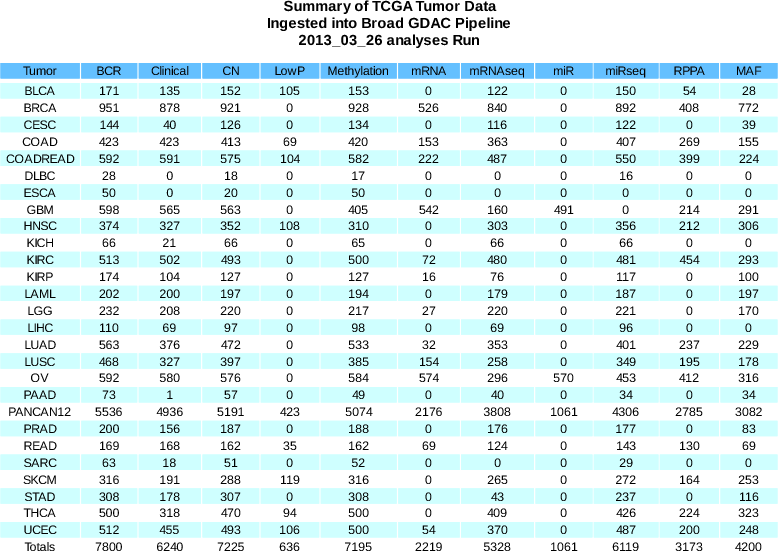
  • Sample Changes: more than 1600 new aliquots ingested

    BCR

    +340

    (7800 total)

    Clinical

    +133

    (6240 total)

    CN

    +369

    (7225 total)

    Methylation

    +436

    (7195 total)

    miRseq

    +59

    (6119 total)

    mRNA

    -3

    (2219 total)

    mRNAseq

    +310

    (5328 total)

  • 4 custom runs for AWGs, including several with multiple subtypes: those with active links are available via firehose_get and the respective dashboards:
  • Minor organizational & documentation enhancements to GDAC site and dashboards
  • MutSig S2N is deprecated and has been removed from pipeline. It has been replaced with MutSig CV. MutSig 1.5 has also been added.
  • CoMut for MutSig2.0 has been corrected to use a Q threshold of 0.1
    • The 2013_02_22 analyses run for CoMut mistakenly used a threshold of 0.5
  • Added directed graph of tasks in each analysis run, to both our FAQ and documentation pages. This will be enhanced in the near future, with a version that allows one to click on a node in the graph to determine inputs for that pipeline task, link to its Nozzle report, etc.
  • Incomplete Pipelines:
    • CoMutCV failed for LAML
    • HotNet did not complete before release for:
      • COADREAD
      • BRCA
      • SKCM
    • A parallelized version of the HotNet task is under development, and expected to run 3-5 times faster.  This will shrink our monthly turnaround times.
  • Updated Pipelines:
    • miRseq_Clustering_Consensus
    • miRseq_Clustering_CNMF
    • CopyNumber_Gistic2_Postprocess_Focal
    • Correlate_Clinical_vs_CopyNumber_Focal
    • Correlate_Clinical_vs_CopyNumber_Arm
    • CopyNumber_Clustering_CNMF

Anchor
February_2013
February_2013

Panel
titleFirehose 2013_02_22 Analysis Run
  • Sample changes since last analyses run

    BCR

    -8

    (7460 total)

    Clinical

    +158

    (6107 total)

    CN

    +304

    (6856 total)

    LowP

    +35

    (636 total)

    MAF

    +266

    (4200 total)

    Methylation

    +141

    (6759 total)

    miRseq

    +433

    (6060 total)

    mRNAseq

    +228

    (5018 total)

  • Increased number of output reports from 614 to 703
  • New AWG Analyses:
    • New pages added on NCI wiki and Broad GDAC site to describe and reflect custom Firehose runs for TCGA analysis working groups
    • Performed and/or released custom AWG runs for LGG, LUAD, GBM, PANCAN12, and THCA

  • New Correlation Analyses (see Nozzle reports in dashboard for more info):
    • Correlate_molecularSubtype_vs_CopyNumber_Arm
    • Correlate_molecularSubtype_vs_CopyNumber_Focal
    • Correlate_molecularSubtype_vs_Mutation

  • Mutation Analyses:
    • CoMut plot inconsistency for MutSig 2.0 results
      • The CoMut plot was generated using a Q threshold of 0.5 (0.1 was used in previous runs)
      • Many more genes are displayed in the plot due to this change
      • This change was inadvertent and the Q threshold will be reverted to 0.1 in the next analyses run
    • MutSigCV introduced (MutSig2N is deprecated, and will be removed next month)
    • MutSig is now compatible with WashU WIG files
    • MutSigPreprocess now more configurable has Firehose native task (no longer GenePattern)
      • Bug fixed that only manifests in certain cases, and only when there are WGS+capture MAFs for some of the same patients
    • GenerateStickFigures* DCC submission archive removed: its content rolled into general Mutsig DCC archive
  • Copy Number Analyses
    • GISTIC now more configurable as Firehose native task (no longer GenePattern)
    • Updated to version 2.0.17a:
      • memory and performance optimization of peak identification code. 
      • SegArray version 1.06 with Mex files added to improve performance. 
      • Fix gistic_plots chromosome shading for q-value 0.
      • fix bug in 2.0.17 where output file "raw_copy_number.pdf" was being named "[pathname '.pdf']"
    • CopyNumber_GeneBySample removed (was only for hg18; its output has been superseded by GISTIC)

  • Pathway Analyses:
    • Now in their own "Pathway Analyses" section of top-level aggregate reports, instead of catch-all "Other" section
    • Restored clarity of pathway analysis task names & output archives:
      • Pathway_Paradigm_mRNA
      • Pathway_Paradigm_mRNA_And_Copy_Number
      • Pathway_Paradigm_RNASeq
      • Pathway_Paradigm_RNASeq_And_Copy_Number
      • Pathway_Hotnet
    • This changes the name of their respective DCC submission archives
  • Output of cluster aggregator Aggregate_Molecular_Subtype_Clusters now packaged for DCC submission:
    • Provides a table of patient vs. clusterings (per datatype, per clustering method)
    • Where each cell indicates the respective patient membership in that given cluster group

  • General Software Tools:
    • firehose_get v0.3.11 released
    • The internal gdac_freeze tool can now input a custom sample set file, to facilitates efficiently analyzing cancer subtypes

...

Panel
title2012_10_24
  • More than 3000 new samples ingested, reflected in a total of 475 analysis reports generated.
  • Sample differences:

    No Format
    BCR    		+171 (7123 total)
    Clinical    	+119 (5798 total)
    CN       	+398 (6212 total)
    LowP    	+23  (501 total)
    Methylation	+882 (6471 total)
    mRNA    	+1   (2225 total)
    mRNAseq  	+808 (4371 total)
    miRseq    	+851 (5644 total)
    MAF    		+323 (3183 total)
    
  • Internally this was a big release, because every pipeline was rewired to accomodate using sample sets of tumors, or normals, or type-specific subsets of each
  • But that should in principle be transparent to external users:  i.e. normals added as of stddata__2012_10_24 are NOT YET REFLECTED  in Firehose analyses (because very few analyses employ them at present)
  • MutSig (v2.0) has been updated to restore the clustered mutations result
  • Correlate_Methylation_vs_mRNA task was fixed to restore probe information removed in previous run
  •  Two enhancements to samples summary report available on our dashboard 
    • Now lists every sample that is filtered from the datastream, with an  explanation of why (see stddata__2012_10_24 release notes for more details)
    • Heatmaps are now included that display available samples per data  type vs. participants  
  • firehose_get v0.3.8:  support additional awg runs, such as awg_thca__2012_10_24 and awg_luad__2012_11_15

Anchor
September_2012
September_2012

Panel
title2012_09_13
  • Sample Changes

    BCR

    +71

    (6952 total)

    Clinical

    +8

    (5679 total)

    CN

    +4

    (5814 total)

    Methylation

    +118

    (5589 total)

    miRseq

    +684

    (4793 total)

    mRNAseq

    +36

    (3563 total)

    RPPA

    +442

    (3173 total)

  • Updated Pipelines:
    • Aggregate_Clusters & Correlate_Clinical_vs_Molecular_Signatures
      • Now handle copy number cNMF and RPPA clustering results.
    • Mutation_Assessor
    • Methylation
      • Major overhaul and optimizations added to improve clustering and expression correlation results.
  • MutSig 
    • Changed from GenePattern pipeline to Firehose workflow:
      • yielding more transparency & job-avoidance on intermediate processing steps
      • and changed output archive names from  gdac*Mutation_Significance*
      •  to MutSigPreprocess2.0, ProcessCoverageForMutSig2.0, MutSigRun2.0, MutSigNozzleReport2.0, MutSigNozzleReportS2N
    • Current version of MutSig (v2.0) is not computing a clustered mutations result. This will be fixed in the next analysis run.
    • New version of MutSig (S2N) added to our analysis run
      • Please note that this version is still in active development and as a result, the significant genes list contains false positives. The algorithm will continue to be refined to eliminate these false positives. In the meantime, an intersection of significant genes found by this version and MutSig v2.0 is suggested to eliminate false positives.

  • firehose_get v0.3.7: reflect addition of PANCAN8 disease cohort, and resumption of COAD and READ cohorts (on top of existing COADREAD aggregate)
     
  • Correlate_Clinical_vs_Methylation currently runs on one methylation probe per gene chosen by negative correlation with corresponding expression data (mRNA/mRNAseq). When insufficient expression data exists, methylation correlation pipelines do not run. In future iterations, when there is insufficient expression data, Correlate_Clinical_vs_Methylation will run on mean probe values per gene.


...

Panel
titleJuly 2012 (2012_07_25)
  • New Samples:

    BCR+160(6846 total)
    Clinical+55(5633 total)
    Methylation+140(5465 total)
    mRNAseq+306(3460 total)
    miRseq+195(3976 total)
  • 32 new reports, for a total of 284 in this run
  • New Pipelines:
    • Correlate_Clinical_vs_CopyNumber_Focal
    • Correlate_Clinical_vs_CopyNumber_Arm
  • MutSig:
    • To address item (9) from 2012_06_23 Analysis Run Release Notes, input WIGs (from stddata__2012_07_25) updated to hg19 for:
      • BLCA
      • BRCA
      • CESC
      • KIRC
      • LUSC
      • LUAD
      • PRAD
      • STAD
      • UCEC
    • STAD failing due to memory exhaustion - ignoring for this release as there is no currently active AWG
    • COADREAD analysis is missing 102 samples. Please see explanation in our email archive.
  • Gistic2
    • Failed for PANCANCER due to memory exhaustion; ignored because it is the large 23-tumor cohort, not yet the 8-tumor cohort defined by AWG.

Anchor
June_2012
June_2012

Panel
titleJune 2012 (2012_06_23)
  1. Increased number of archives generated from 777 to 993

  2. Increased number of reports from 227 to 252
  3. 2,244 new samples reflected since May analyses run, due to more data and better counting:
    • 76 LowP (new sample type - Low Pass DNAseq)
    • 230 BCR
    • 307 Clinical
    • 618 mRNAseq
    • 937 miRseq
    • 76 MAF
  4. GISTIC2 report now includes a description of both the input and output files in the Methods & Data section
  5. Methylation data:

    • Rewired pipelines to include meth450 platform, and also give it preference over meth27 when both are present.
      (Methods to combine 450 & 27 analytically are not in Firehose: would be nice for AWGs to provide if possible)

    • This greatly increases count of methylation samples flowing through analyses (e.g. UCEC 117–>363)

    • Most clusterings show similar results, but some are discordant with previous runs:  we could use AWG help to evaluate, and will post comparative analysis online towards that end
  6. New clustering pipelines heuristic: a sample will be dropped from analyses when 80% or more genes are absent.
  7. mRNAseq: we now utilize rnaseqv2 archives, but fall back to v1 rnaseq when v2 is not available for a given tumor type
    • RSEM estimation used for downstream clustering & correlation analysis, when available, otherwise RPKM estimation will used
    • RSEM is used to estimate gene and transcript abundances (http://deweylab.biostat.wisc.edu/rsem/rsem-calculate-expression.html); values are normalized to a fixed upper quartile value of 1000 for gene and 300 for transcript level estimates, and the normalized values are placed in a separate file (From the DCC document).
    • The following showed the boxplot of BRCA mRNAseq samples with log2 transformed RESM (left) and RPKM (right). 

  8. Improvements to clinical correlations:
    • Use try/catch to avoid needless failures when parameters are moved in XML scheme
    • Towards aim of having survival curves ALWAYS generated for ALL disease types
    • Archives now generated for clinical correlations:  33 in this run alone (versus zero in previous runs)
  9. MutSig:
    1. Updated to v2.0, which among other enhancements now distinguishes between hg18 and hg19 builds.  Alas, we did not correct for hg19 in time for the run, so results for all tumor data based upon hg19 (BLCA, BRCA, CESC, KIRC, LUSC, LUAD, PRAD, STAD, and UCEC) SHOULD NOT BE USED; archives were not posted to DCC, but the reports will remain online for inspection.
    2. Nozzle report now includes visually compelling, integrative"CoMut" plot.

...