Frequently Asked Questions
...
| Panel |
|---|
Q: Where can I find the mutation rates calculated during Firehose analyses?A: Mutation rates are calculated by MutSig, and can be found in the |
| Panel | ||||||
|---|---|---|---|---|---|---|
2CV?A: MutSig relies on several sources of evidence in the data to estimate the amount of positive selection a gene underwent during tumorigenesis. The three main sources are:
The first line of evidence, Abundance, goes into the core significance calculation performed in all versions of MutSig. In MutSig1.0, this is simply called "p". MutSig1.0 assumes a constant BMR across all genes in the genome and all patients in the patient cohort. In MutSig1.5, this is also called "p", but MutSig1.5 uses information from synonymous mutations to roughly estimate gene-specific BMRs. Later versions of MutSig (MutSigS2N and MutSigCV) have increasingly sophisticated procedures for treating the heterogeneity in per-gene, per-patient, and per-context BMRs, but they are all answering essentially the same question about Abundance of mutations above the background level. The other lines of evidence, Conservation and Clustering, are examined by a separate part of MutSig that performs many permutations, comparing the distributions of mutations observed to the null distribution from these permutations. The output of this permutation procedure is a set of additional p-values: p_clust is the significance of the amount of clustering in hotspots within the gene. p_cons is the significance of the enrichment of mutations in evolutionarily conserved positions of the gene. Finally, p_joint is the joint significance of these two signals (Conservation and Clustering), calculated according to their joint distribution. The reason for calculating p_joint is to ensure there is no double-counting of the significance due, for example, to clustering in a conserved hotspot. Combining MutSig2CV combines all three lines of evidence: In order to take a full accounting of the signals of positive selection in a given gene, we combine all three lines of evidence. This is done by using the Fisher method of combining p-values. The two p-values combined are the "p" (or "p_classic") from the analysis of mutation Abundance, and the p_joint from the analysis of Conservation and Clustering in MutSig2.0. More information on MutSig is available on its entry in the CGA software . More information on MutSig is available on its entry in the CGA software page, the 2013 and 2014 MutSig publications and , dozens of TCGA-related papers, and in their respective reports. |
| Panel | ||||||||||||||||||||||||||||||||||||||||||||||||||||||||||||||||||||||||||||||||||||||||||||||||||||||||||||||||||||||||||||||||||||||||||||||||||||||||||
|---|---|---|---|---|---|---|---|---|---|---|---|---|---|---|---|---|---|---|---|---|---|---|---|---|---|---|---|---|---|---|---|---|---|---|---|---|---|---|---|---|---|---|---|---|---|---|---|---|---|---|---|---|---|---|---|---|---|---|---|---|---|---|---|---|---|---|---|---|---|---|---|---|---|---|---|---|---|---|---|---|---|---|---|---|---|---|---|---|---|---|---|---|---|---|---|---|---|---|---|---|---|---|---|---|---|---|---|---|---|---|---|---|---|---|---|---|---|---|---|---|---|---|---|---|---|---|---|---|---|---|---|---|---|---|---|---|---|---|---|---|---|---|---|---|---|---|---|---|---|---|---|---|---|---|
| ||||||||||||||||||||||||||||||||||||||||||||||||||||||||||||||||||||||||||||||||||||||||||||||||||||||||||||||||||||||||||||||||||||||||||||||||||||||||||
Q: What do the different fields for significantly mutated genes mean?A: Many of these fields depend on what version of MutSig was used. The following table covers the majority of them:
| ||||||||||||||||||||||||||||||||||||||||||||||||||||||||||||||||||||||||||||||||||||||||||||||||||||||||||||||||||||||||||||||||||||||||||||||||||||||||||
...
| Panel |
|---|
Q: Where can I find a copy of the blacklist used in MutSig runs?A: The blacklist is used to filter out recurrent mutation sites that the MutSig development team found to cause issues with the determination of significance. Because these by nature include germline mutations that may not have been part of available databases at the original generation of the MAF, we are not permitted to release it to the public. |
| Panel |
|---|
Q: Why does your table of ingested data show that disease type XYZ has N methylation samples?A: We ingest and support both of the major methylation platforms (Infinium HumanMethylation450 and HumanMethylation27), therefore the entries in our data table give the sum of both. However, as noted in our June 2012 release notes, Firehose does not yet include the statistical algorithms used by TCGA AWGs to merge both of these methylation platforms into a single bolus; until those are shared we prefer |
...
| Panel | ||||||
|---|---|---|---|---|---|---|
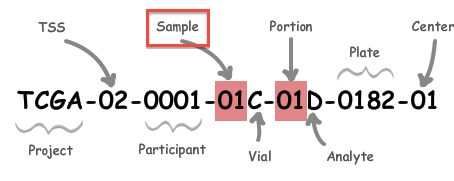
A: All analysis-ready patient samples are available in our stddata archives; this will include matched normals, where available (but note that the so-called TCGA control samples are not included). Normals can be identified by inspection of the barcode schema below, in conjunction with the TCGA code tables. You can obtain the stddata archives using our firehose_get utility or by traversing the FireBrowse user interface or stddata API. Each sample in the archive is identified by a TCGA Barcode that contains the sample type. As shown below, the Sample portion of the barcode can be looked up in the sample type code table available here (as can the tissue source site, aka TSS, et cetera). In addition, FireBrowse makes much of this information available programmatically in its metadata API. TCGA Barcode Description: As described here, a batch is uniquely determined by the first shipment of a group of analytes (or plate) from the Biospecimen Core Resource. So, in most cases the plate number of a sample is effectively synonymous with the batch id of the sample; an exception to this is when additional analytes from a participant are subsequently shipped the batch id will remain fixed at the first plate number.
|
| Panel |
|---|
Q: Where can I find additional information about a TCGA sample/analyteA: While the TCGA was active samples notes (aka annotations) had been maintained at the TCGA Annotations Manager. In July of 2016, however, the data portal of TCGA went offline, with all data (including annotations) having been migrated to the Genomic Data Commons. Please contact the GDC staff for details on how annotation information may be obtained after July 2016. |
...
| Panel |
|---|
Q: How are the copy number data generated, and what do their file names mean?A: This is discussed in the application note posted here: http://www.broadinstitute.org/cancer/cga/copynumber_pipeline. Note that the 'minus_germline, or 'nocnv' segment files, refer to whether the steps in section 2.3 are applied. The steps in section 2.4 are applied regardless. |
| Panel |
|---|
Q: What centers are responsible for sequencing XYZ tumor?A: Internally at the Broad we maintain /wiki/spaces/CGW/overview#CancerGenomeWorkgroup-Tumor_Sequencing_Centers If you are outside the Broad please consult the TCGA site for more information. |
...
| Panel | ||||||
|---|---|---|---|---|---|---|
A: RPKM and RSEM are different methods for estimating expression levels from mRNASeq data. RPKM (Reads Per Kilobase per Million mapped reads) is described in a paper by Mortazavi, Williams, McCue, Schaeffer & Wold titled Mapping and quantifying mammalian transcriptomes by RNA-Seq. RSEM (RNA-Seq by Expectation-Maximization) is considered by many to be a better estimation method and, if available, RSEM data is preferentially used in our downstream analyses. It is described in a paper by Bo Li & Colin Dewey titled RSEM: accurate transcript quantification from RNA-Seq data with or without a reference genome. |
| Panel |
|---|
Q: How do I map mRNA isoform IDs to genes?A: We do not provide a mapping table for this, because in TCGA these data are generated by the University of North Carolina. However, for internal analyses we and others frequently use the UCSC Table Browser, e.g. as described in this BioStars recipe. |
...